Data, diagrams & charts
From source and data to a visual story
Section titled “From source and data to a visual story”Six real visual examples, including a local image, from the English sales proposal. Every metric is fictional. Select a preview to read its page-specific source.
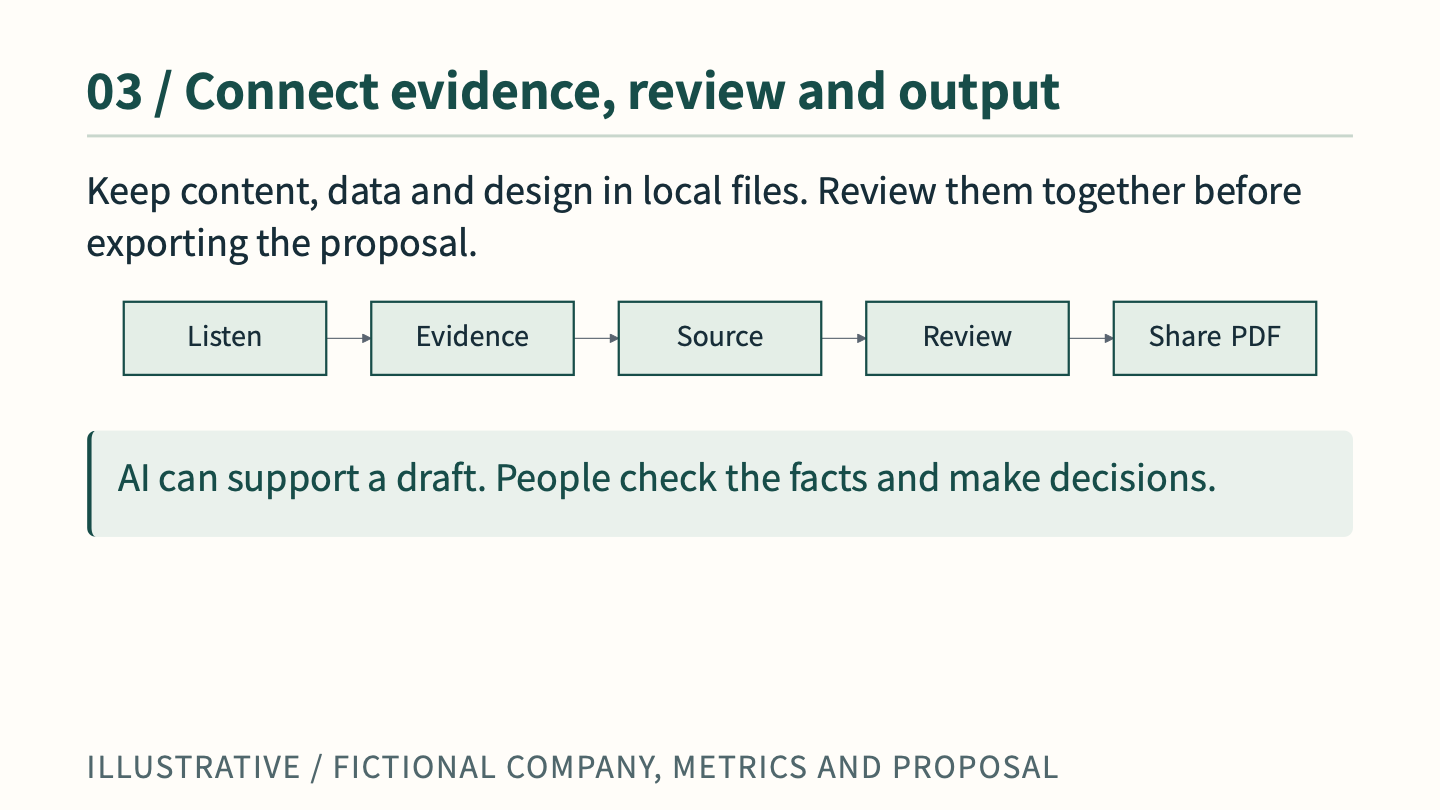
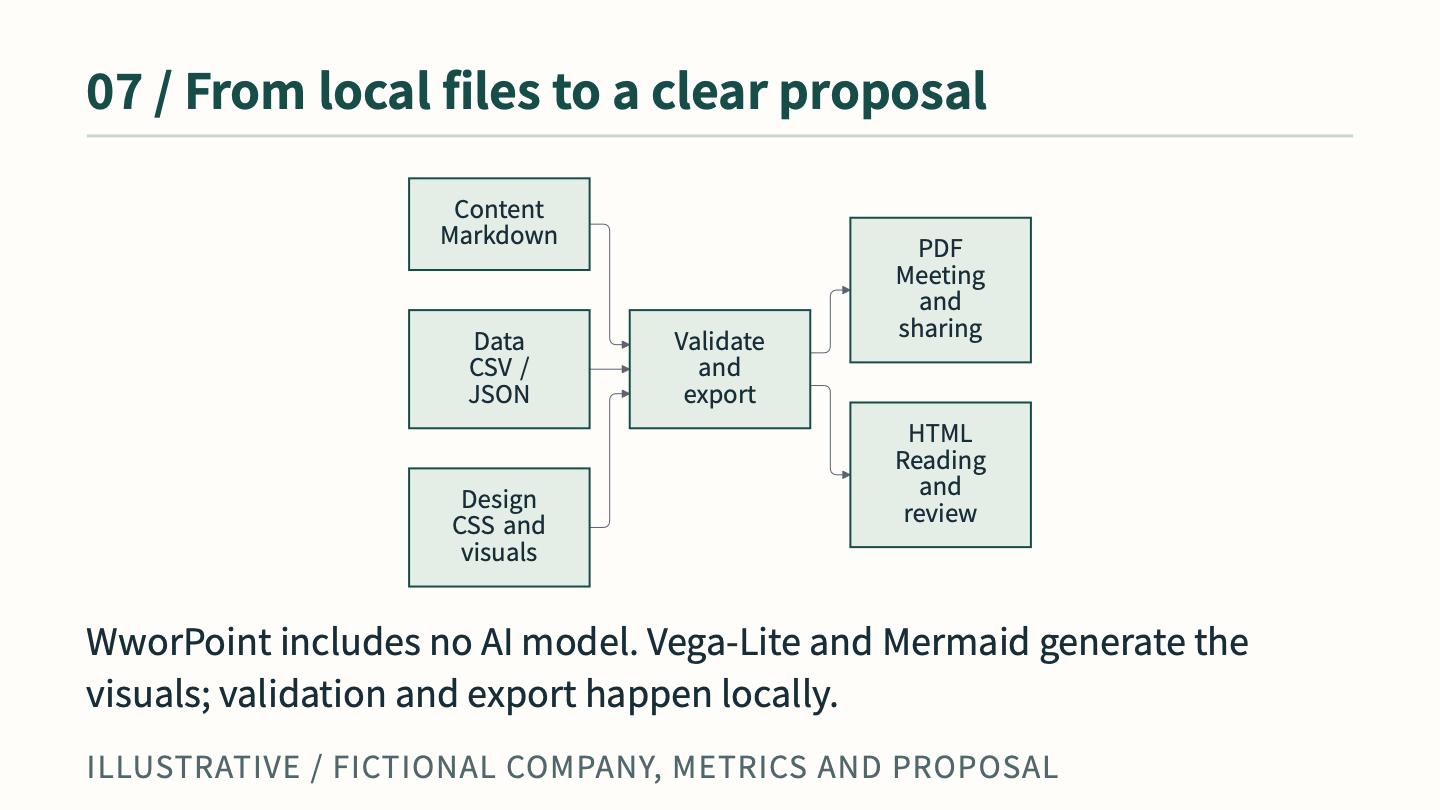
Full example overview and downloads
Insert an image file
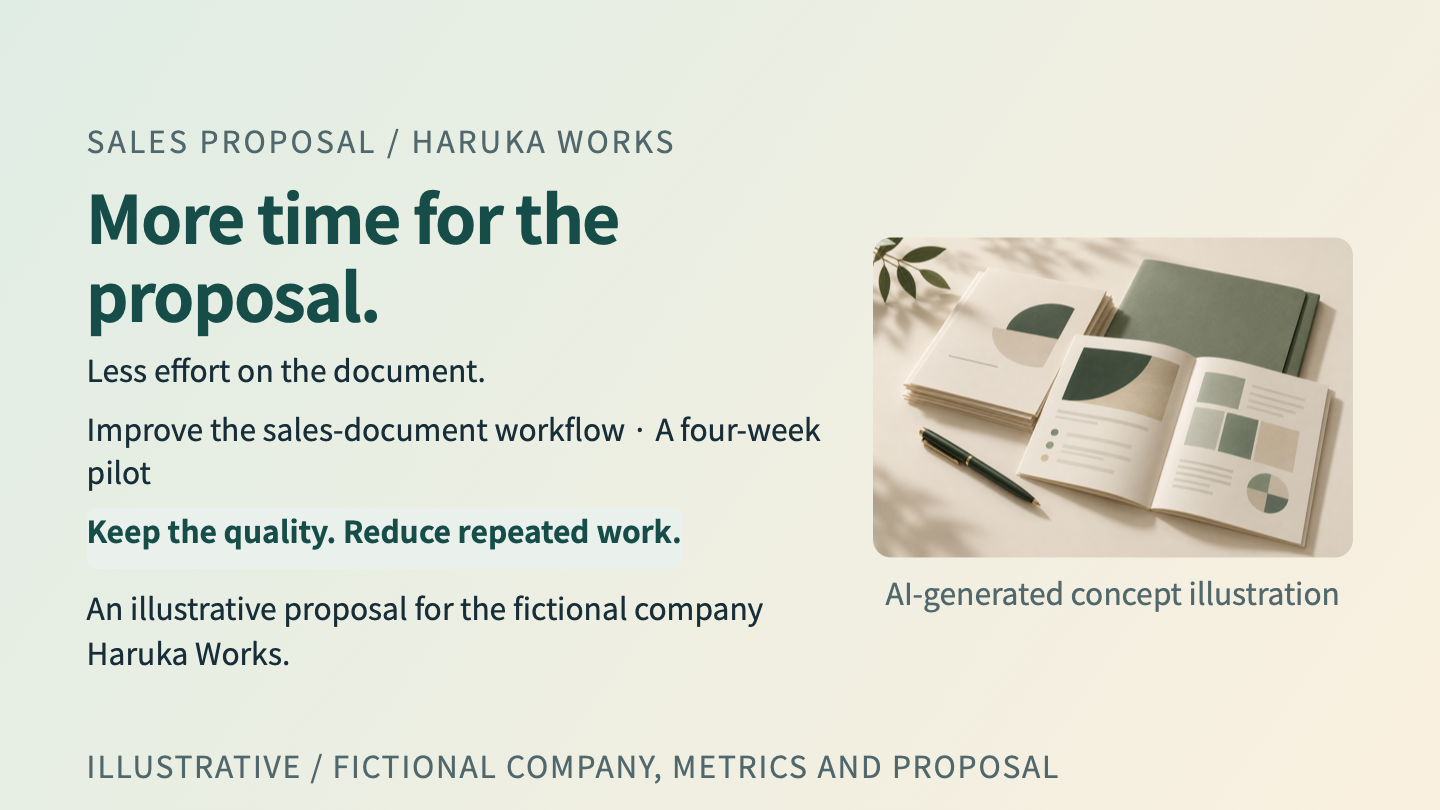
Section titled “Insert an image file”A Markdown image reference inserts a PNG stored inside the project. The quoted title becomes its caption. The cover CSS places text and image in a normal-flow grid.
Read the actual page source and open its image
Reproduce it from the sources
Section titled “Reproduce it from the sources”The ZIP includes Markdown, CSS, CSV, Vega-Lite JSON, Mermaid sources and project settings. No remote data or HTML scripts.


<!-- wwpo:table data=rollout caption="Illustrative pilot plan" -->Vega-Lite: local named CSV
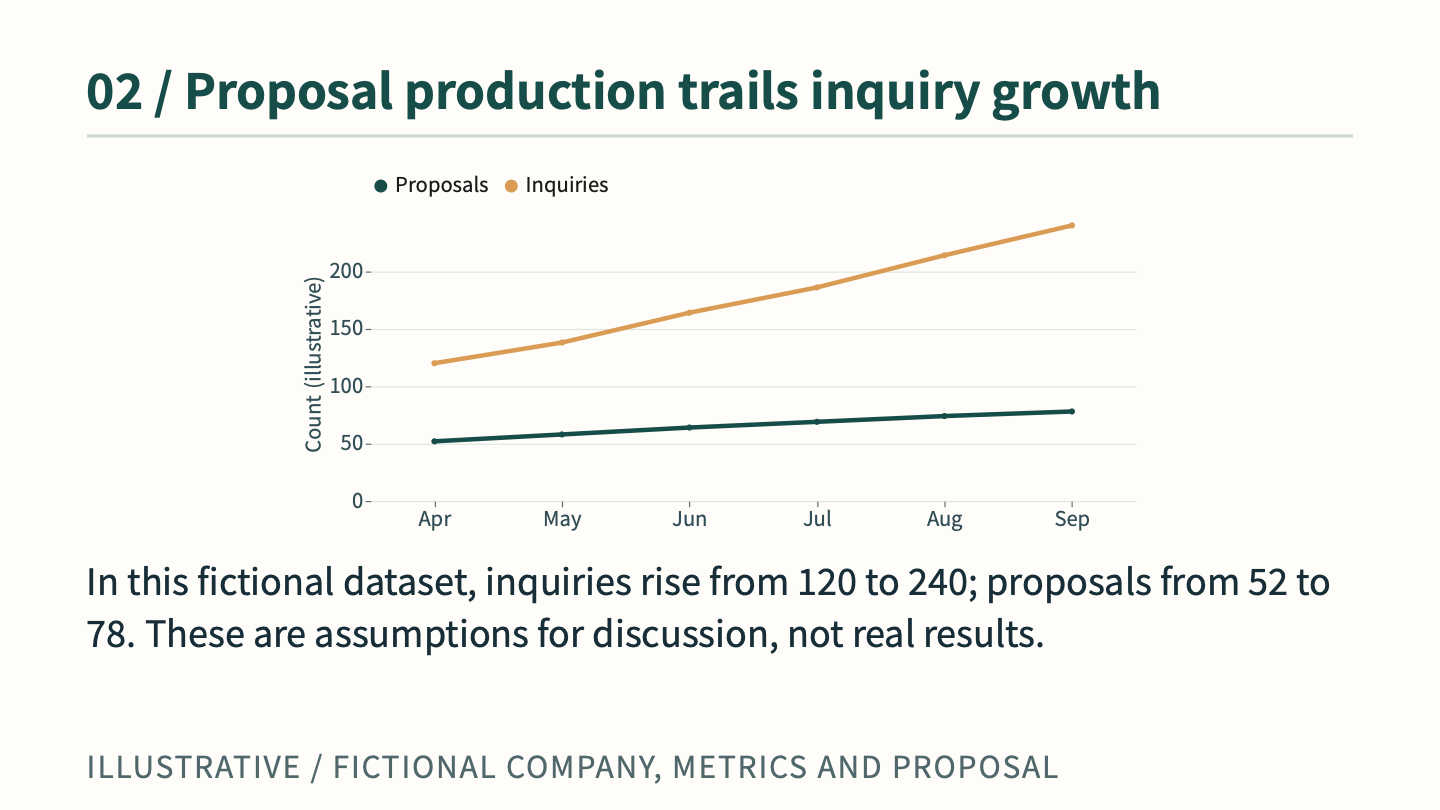
Section titled “Vega-Lite: local named CSV”trend resolves to data/trend.csv. This is the essential structure of the actual spec; the complete styled version is in the source ZIP.
{"data":{"name":"trend"},"transform":[{"fold":["Inquiries","Proposals"],"as":["Series","Count"]}],"mark":{"type":"line","point":true},"encoding":{"x":{"field":"Month","type":"ordinal"},"y":{"field":"Count","type":"quantitative"},"color":{"field":"Series","type":"nominal"}}}Mermaid: the review process in text
Section titled “Mermaid: the review process in text”flowchart LR A["Listen"] --> B["Evidence"] --> C["Source"] --> D["Review"] --> E["Share PDF"]Sales proposal · 10 slides · A4 proposal · 5 pages · Authoring manual
Sequence diagram
Section titled “Sequence diagram”Actual output from the fictional booking specification, rendered by the current Mermaid renderer. It is a proposed design, not an implemented service.
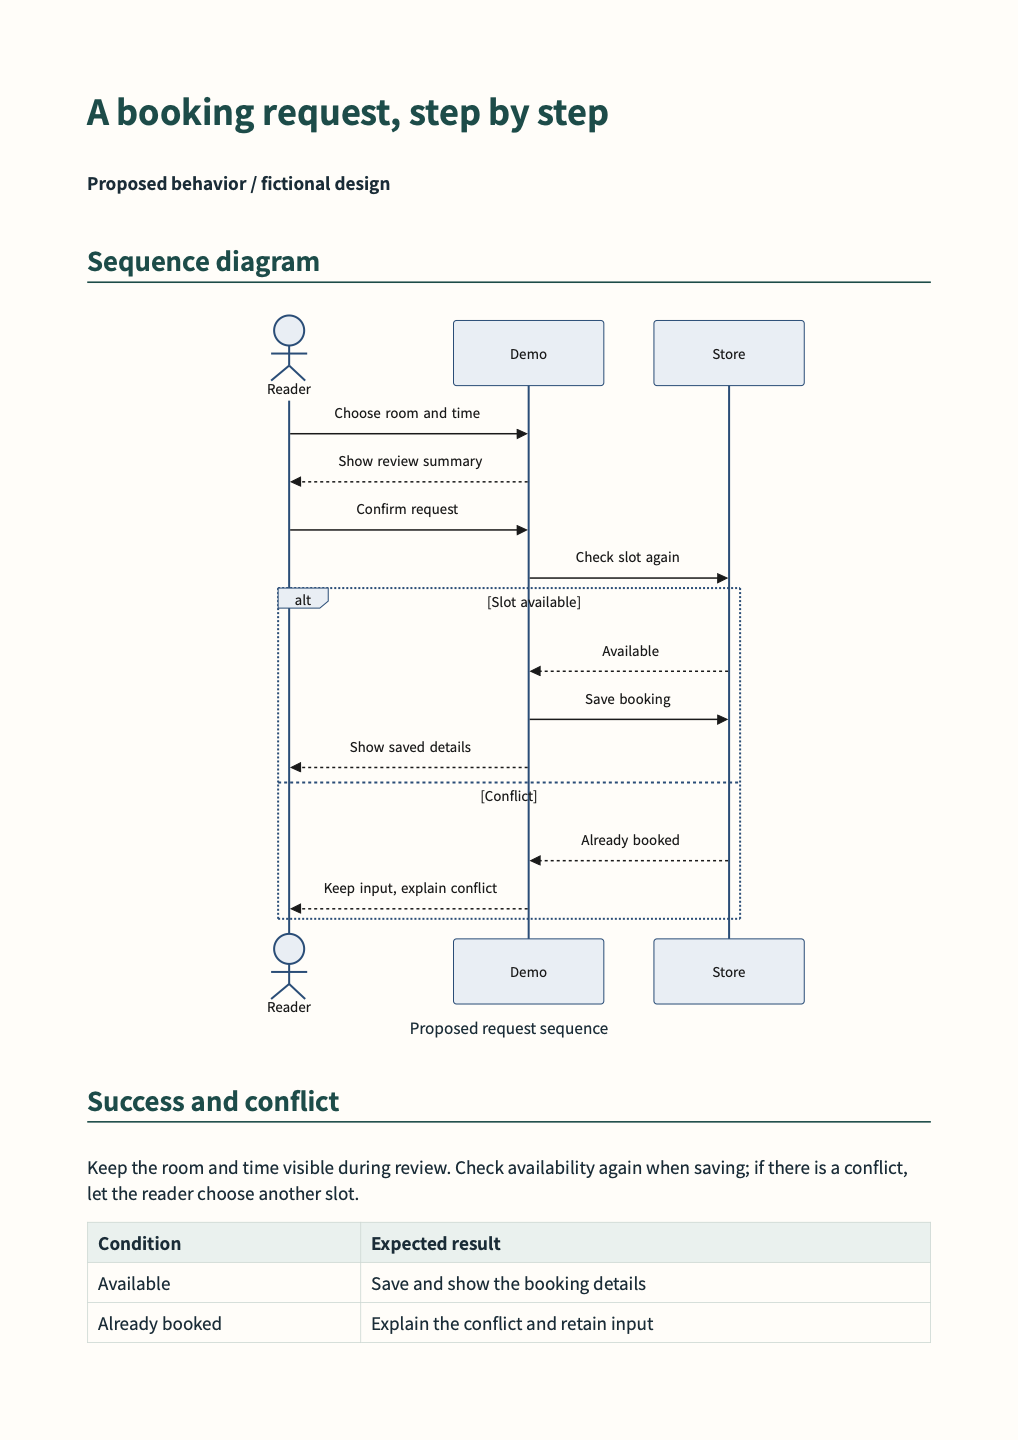
assets/diagrams/sequence.mmd
sequenceDiagram actor Reader participant Demo participant Store Reader->>Demo: Choose room and time Demo-->>Reader: Show review summary Reader->>Demo: Confirm request Demo->>Store: Check slot again alt Slot available Store-->>Demo: Available Demo->>Store: Save booking Demo-->>Reader: Show saved details else Conflict Store-->>Demo: Already booked Demo-->>Reader: Keep input, explain conflict endClass diagram
Section titled “Class diagram”Actual output from the fictional booking specification, rendered by the current Mermaid renderer. It is a proposed design, not an implemented service.
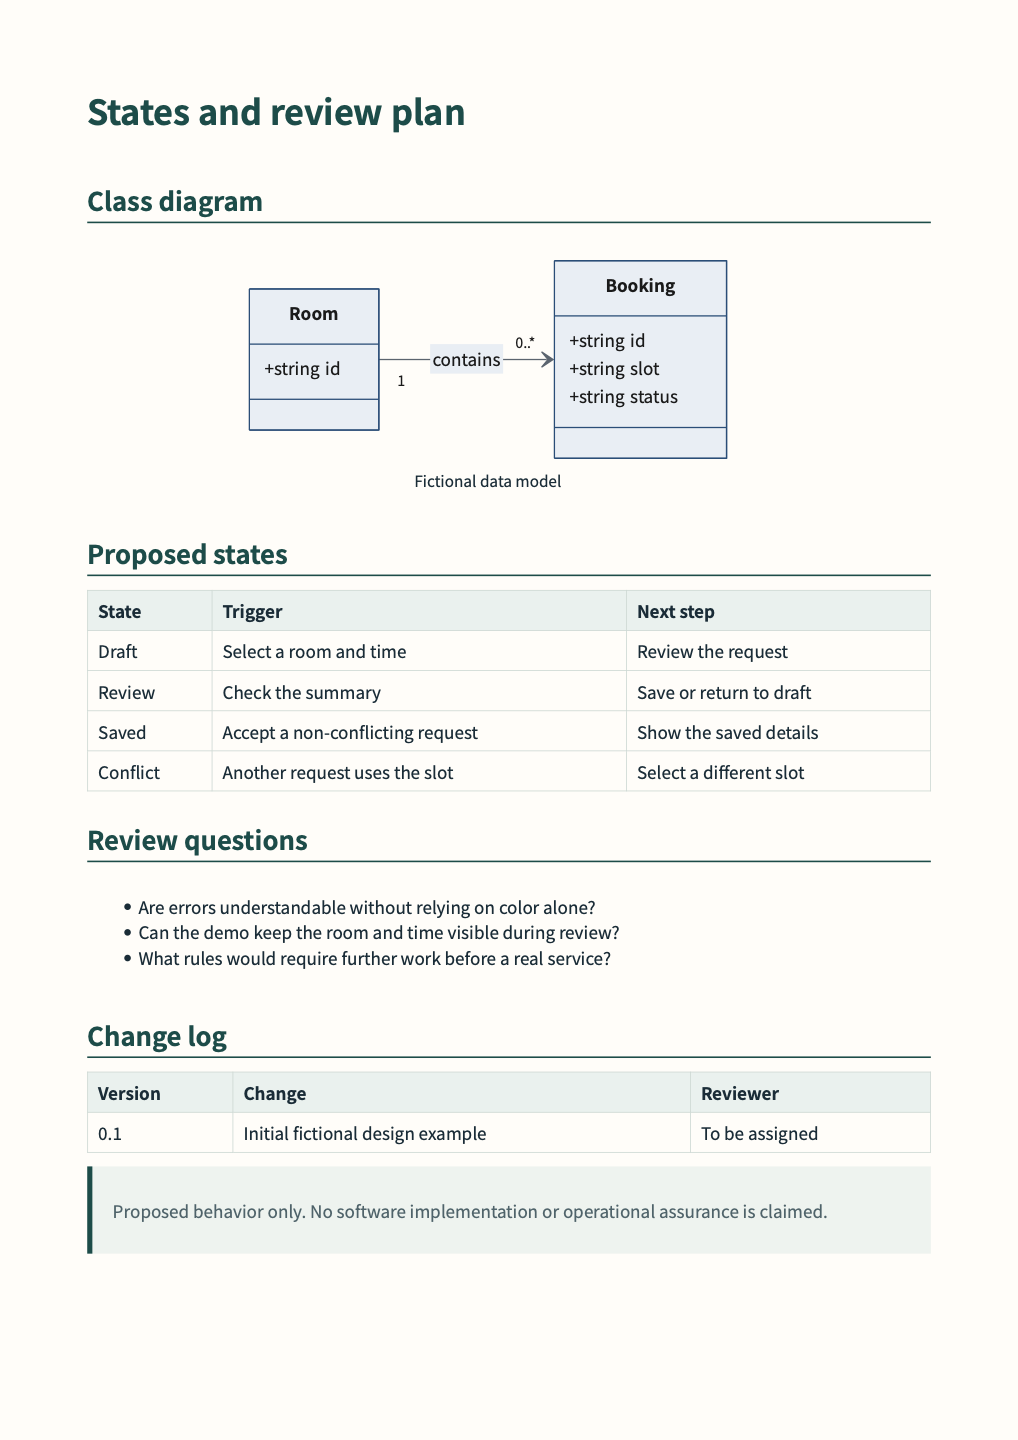
assets/diagrams/classes.mmd
classDiagram direction LR class Room { +string id } class Booking { +string id +string slot +string status } Room "1" --> "0..*" Booking : containsComparison table
Section titled “Comparison table”A fictional comparison with six detail rows, two subtotals and a grand total. Group, quantity, unit price, amount, baseline and delta stay visible; numeric columns align right, alternating rows aid reading, and subtotals/totals are emphasized. No merged cells.
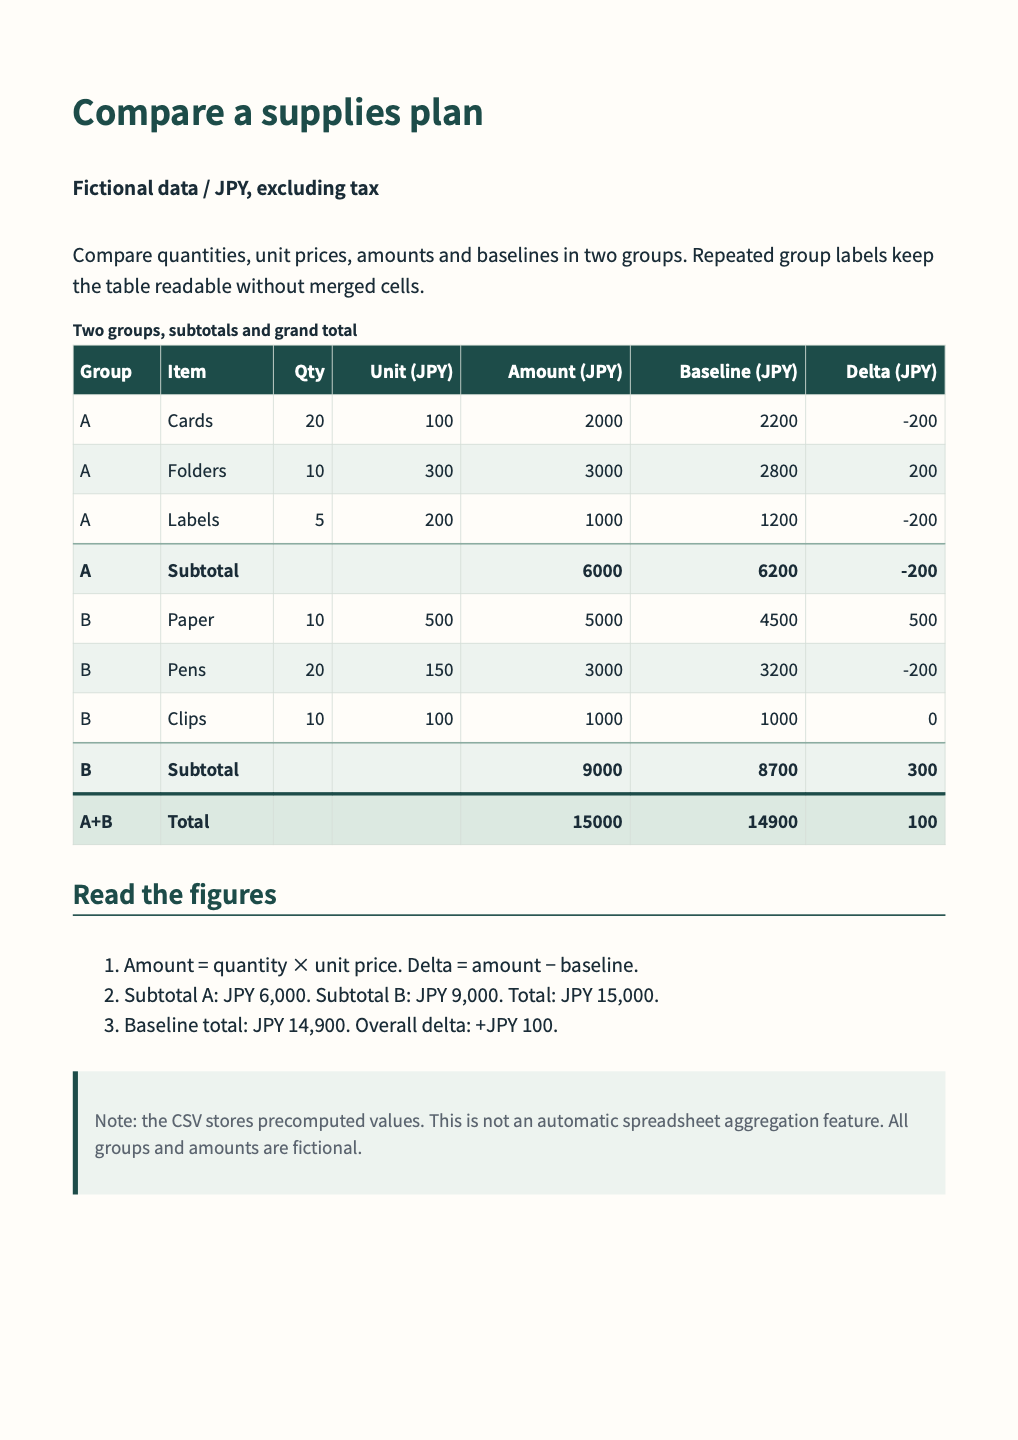
Amount = quantity × unit price; delta = amount − baseline. Subtotals 6,000 + 9,000 = JPY 15,000; baseline JPY 14,900; delta +JPY 100. Fictional values exclude tax. The CSV stores precomputed results; WworPoint does not aggregate them automatically.
data/comparison.csv
Group,Item,Qty,Unit (JPY),Amount (JPY),Baseline (JPY),Delta (JPY)A,Cards,20,100,2000,2200,-200A,Folders,10,300,3000,2800,200A,Labels,5,200,1000,1200,-200A,Subtotal,,,6000,6200,-200B,Paper,10,500,5000,4500,500B,Pens,20,150,3000,3200,-200B,Clips,10,100,1000,1000,0B,Subtotal,,,9000,8700,300A+B,Total,,,15000,14900,100Inspect exact Markdown, CSV, CSS and settings through the page source and ZIP above.