Comparison table / Page 1 source
Source for page 1 of 1 of the actual generated example. Companies, metrics and proposals are fictional. This excerpt is not a standalone document: it needs the shared theme, configuration and referenced files.
Markdown for this page
Section titled “Markdown for this page”An excerpt of document.md, split at its explicit page boundary. Separate fixed pages with <!-- wwpo:break -->.
document.md
Section titled “document.md”<!-- wwpo:page flow=fixed -->
# Compare a supplies plan
**Fictional data / JPY, excluding tax**
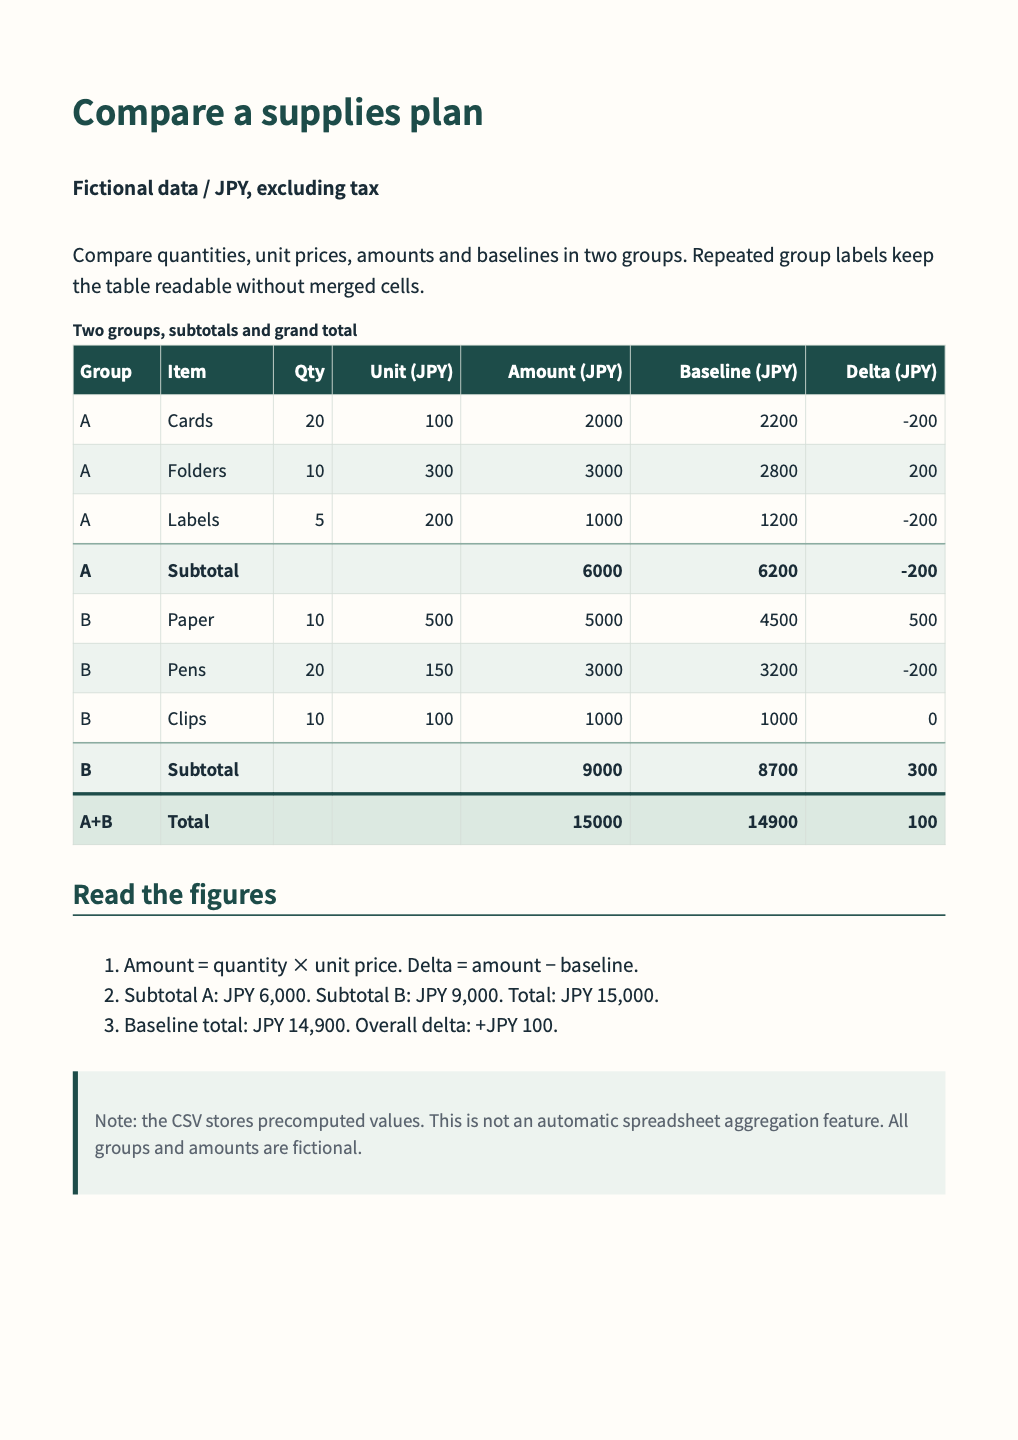
Compare quantities, unit prices, amounts and baselines in two groups. Repeated group labels keep the table readable without merged cells.
<!-- wwpo:block class="comparison-table" -->
<!-- wwpo:table data=comparison caption="Two groups, subtotals and grand total" -->
## Read the figures
1. Amount = quantity × unit price. Delta = amount − baseline.
2. Subtotal A: JPY 6,000. Subtotal B: JPY 9,000. Total: JPY 15,000.
3. Baseline total: JPY 14,900. Overall delta: +JPY 100.
> Note: the CSV stores precomputed values. This is not an automatic spreadsheet aggregation feature. All groups and amounts are fictional.Referenced visuals and data
Section titled “Referenced visuals and data”data/comparison.csv
Section titled “data/comparison.csv”Group,Item,Qty,Unit (JPY),Amount (JPY),Baseline (JPY),Delta (JPY)
A,Cards,20,100,2000,2200,-200
A,Folders,10,300,3000,2800,200
A,Labels,5,200,1000,1200,-200
A,Subtotal,,,6000,6200,-200
B,Paper,10,500,5000,4500,500
B,Pens,20,150,3000,3200,-200
B,Clips,10,100,1000,1000,0
B,Subtotal,,,9000,8700,300
A+B,Total,,,15000,14900,100
Design and reproduction
Section titled “Design and reproduction”Headings, spacing, color, tables and page footnotes use the shared CSS and business preset. Page directives and visual definitions shown above also affect the output. The source ZIP on the example overview contains the complete document and required files. Save changes, then preview, validate and export to check them.